
Once of my first projects this year was a refresh of the Love Worth Fighting For Marriage Event website. Notable in this build was our move away from WordPress as our event listings backend and on to a Google Sheets + Sheetrock.js powered view. I’ll explain how I made this move below, but first here’s a look at the site:

As you can see, I’ve designed the site as a one-page scroller with a hero-unit, about section, and a listing of upcoming events. I used the Milligram framework as my base. The interesting part of this design takes place in the upcoming events listing. To build that listing, I’m querying a Google Sheet via Sheetrock.js. Here’s a look at the spreadsheet and the listing I’ve built with it:
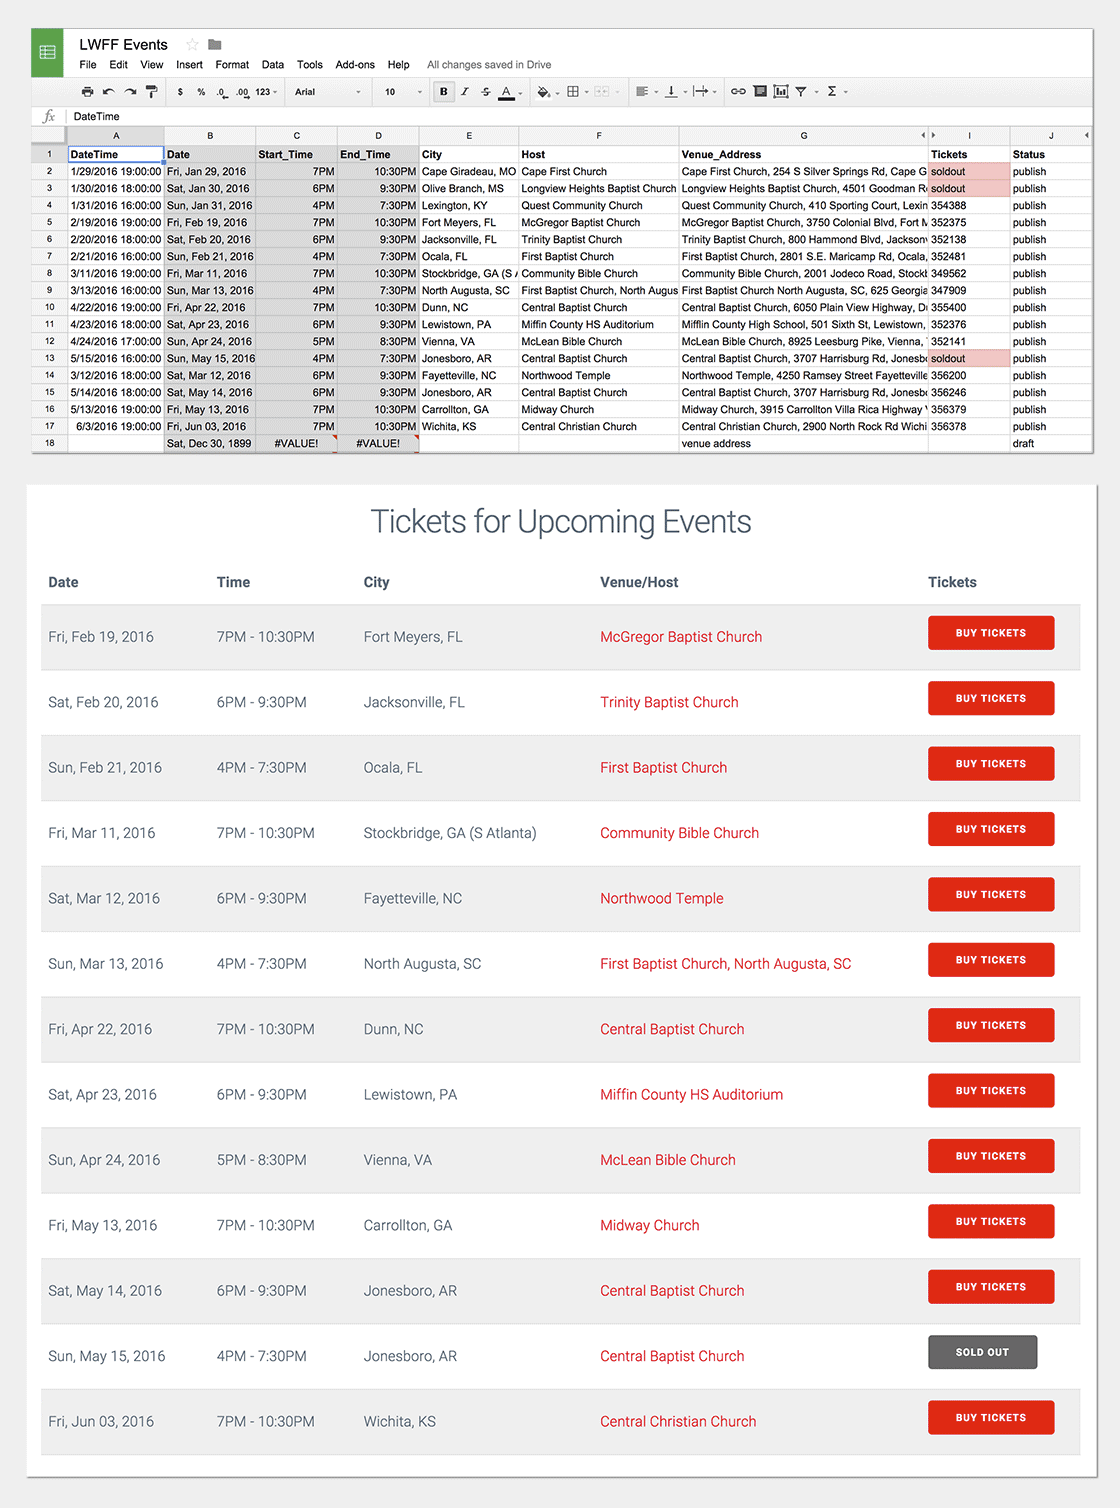
I have my app setup such that anytime we need to add an event, we enter a new row in our Google spreadsheet. The white columns in my sheet are the ones we fill out, and the greyed-out columns perform date calculations based off of the DateTime column.
While I was developing the app, I found that I couldn’t get my Google Visualization API Query Language query (Sheetrock.js uses it for the actual SQL-like query to your spreadsheet) to manipulate my DateTime values into the formats I needed. So, I added the grey-out columns where I’m formatting the DateTime column. Then, instead of trying to write my query such that it formats the DateTime, I simply retrieve the pre-formatted columns I need for my display.
Key features of this app:
- The
Ticketscolumn can be either theIDused in our ticketing link orsoldoutwhich marks an event as SOLD OUT. - Only events with a
Status=publishshow on the site. - My Sheetrock.js query is date-based so that it only retrieves the current day’s and future events
I’ve made a JSfiddle demonstrating my code.
Leave a Reply